
Individual penalties and lawsuit odds are alarming in isolation; the business case is built when you aggregate them. A complete exposure model sums probability-weighted OSHA and I-9 penalties, wage-and-hour liability, employment-claim risk (a roughly 10.5 percent annual chance, higher in some states), premium overpayment versus group rates, and the value of leadership time lost to HR. The aggregate figure — often well into six figures for a mid-sized employer — is the number that justifies adequate HR support or the right PEO. This article shows how to build it.
Why Aggregate the Risk?
No single number tells the story; the sum does. Each exposure — OSHA, I-9, wage-and-hour, employment litigation, premium overpayment, lost time — looks manageable alone and easy to defer. Aggregated and probability-weighted, they reveal the real annual cost of running without adequate HR support. The purpose of the model is not to alarm but to decide: a clear total lets you weigh the cost of coverage against the cost of exposure and make the call on evidence rather than optimism.
What Goes Into the Model?
A complete model spans penalties, litigation, cost, and time. Build it from six inputs:
- Probability-weighted OSHA exposure for your industry (up to $165,514 per willful violation in 2026).
- I-9 and verification error exposure, priced per form across your workforce.
- Wage-and-hour liability from misclassification or off-the-clock risk, multiplied across employees.
- Employment-claim exposure — roughly a 10.5 percent annual chance, higher in some states — at $75,000–$125,000 defense plus settlement risk.
- Benefits premium overpayment versus large-group rates.
- The value of leadership time lost to HR (about 70 percent of leaders spend over a week a month).
How Do You Probability-Weight Each Risk?
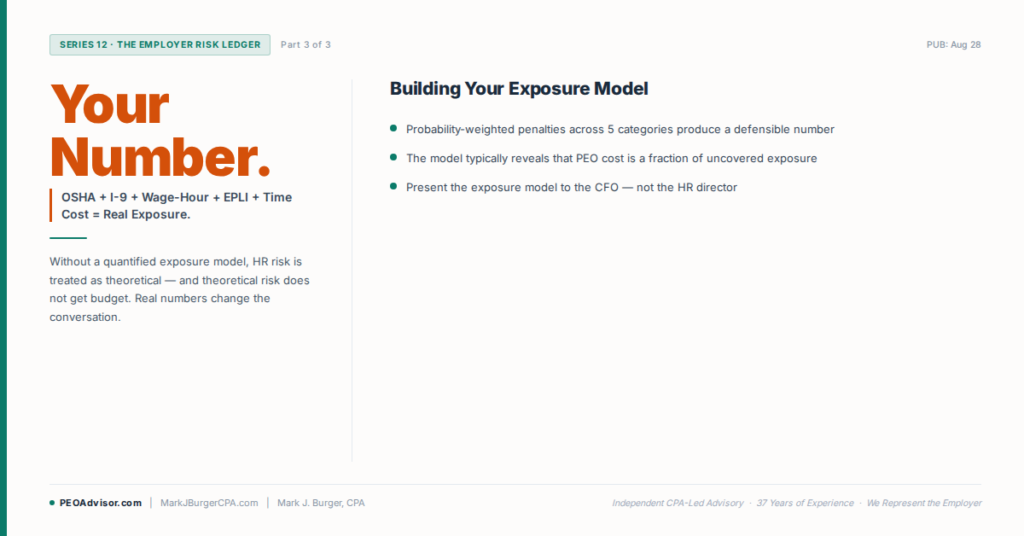
Weight each exposure by likelihood, not just maximum. A $165,514 OSHA maximum is not your expected cost; your expected cost is that figure times the probability of a willful citation given your industry and safety record. Apply the same logic to each component — likelihood times impact — to produce an expected annual exposure. Use conservative ranges and show your assumptions, so the total is defensible and can be tested rather than dismissed as fearmongering.
| Want to see your own number? Download our Aggregate Exposure Model Template — build your business’s risk number on one page — through a no-cost PEO Advisor assessment. Start the Exposure Model assessment |
How Does the Model Map to Coverage?
Then match each exposure to what actually reduces it. For every component, identify the control: safety programs for OSHA, accurate onboarding for I-9, wage-and-hour compliance support for misclassification, EPLI for litigation, group purchasing for premium overpayment, and administrative offload for lost time. A capable PEO addresses all six at once, which is why the aggregate model so often points toward one. Mapping exposure to coverage turns the number into an action plan, not just a warning — the same logic we applied to the cost of getting HR wrong at the individual-category level.
How Does a PEO Reduce Aggregate Employer Risk?
The total is the business case. Set the aggregate expected exposure against the cost of the support that reduces it — in-house build or a PEO — and decide on the net. For most mid-sized employers the exposure figure is large enough that adequate coverage pays for itself before a single event occurs. PEO Company’s comparison of outsourcing HR to a PEO versus building it in-house lays out that same trade-off from the operating-cost side, worth reviewing alongside the risk side built here. Revisit the model as you grow or change states, and use it to justify the decision to a partner, board, or your own future self. Risk, quantified, is simply another line in the business case.

This content is educational, not legal, tax, or insurance advice. Figures are 2026 and illustrative; verify at publish and tailor to your business.
Ready to build your exposure number? Contact Mark J. Burger, CPA to model your risk and map it to coverage.
Frequently Asked Questions

- How do I build an HR risk exposure model? Aggregate six inputs: probability-weighted OSHA penalties, I-9 error exposure per form, wage-and-hour liability across your workforce, employment-claim risk (about a 10.5 percent annual chance) at $75,000–$125,000 defense plus settlement, benefits premium overpayment versus group rates, and the value of leadership time lost to HR. Weight each by likelihood times impact and show assumptions to produce a defensible annual figure.
- Why aggregate HR risks instead of looking at them individually? Because each exposure looks manageable alone and easy to defer, while the probability-weighted sum reveals the real annual cost of inadequate HR. Aggregating converts scattered statistics into one defensible number that lets you weigh the cost of coverage against the cost of exposure — turning risk into a business case decided on evidence rather than optimism.
- What should I include in an employer exposure model? Include probability-weighted OSHA exposure (up to $165,514 per willful violation in 2026), I-9 error exposure per form, wage-and-hour liability across employees, employment-claim risk with defense and settlement costs, benefits premium overpayment versus large-group rates, and the value of leadership time lost to HR. Together these span penalties, litigation, cost, and time.
- How do I know what my risk is actually worth? Weight each exposure by likelihood, not just its maximum. The $165,514 OSHA figure is a ceiling; your expected cost is that amount times the probability of a willful citation given your industry and safety record. Apply likelihood-times-impact to every component, use conservative ranges, and show assumptions, producing an expected annual exposure that is defensible and testable.
- How does a PEO reduce aggregate HR exposure? A PEO addresses the components at once: safety programs for OSHA, accurate onboarding for I-9, wage-and-hour compliance support, EPLI for litigation, group purchasing to cut premium overpayment, and administrative offload for lost time. Because it reduces all six categories that drive the aggregate figure, the exposure model frequently points toward a PEO as the efficient control.
- Is quantifying HR risk worth the effort? Yes, because for most mid-sized employers the aggregate expected exposure is large enough that adequate coverage pays for itself before any single event occurs. A quantified model justifies the decision to a partner, board, or owner, guides which controls to prioritize, and can be revisited as the business grows or adds states. Risk, quantified, is simply another line in the business case.
About the author. Mark J. Burger, CPA, advises small and mid-sized businesses on strategic workforce and co-employment decisions through GuidePoint PEO LLC. His analysis draws on decades of CPA practice and hundreds of PEO cost assessments.


