The Average Cost of Employer-Sponsored Health Insurance
The average cost of employer-sponsored health insurance reached $17,496 per employee in 2025, according to Mercer’s National Survey of Employer-Sponsored Health Plans — a 6 percent increase well above the rate of inflation and wage growth. The average family premium now stands at $26,993, according to the KFF 2025 Employer Health Benefits Survey. Mercer projects a further increase of 6.7 percent in 2026, pushing the average above $18,500 per employee.
Most employers inside a PEO arrangement have no independent benchmark to determine whether what they are paying is competitive, inflated, or something in between.
After 37 years reviewing PEO contracts and advising mid-market employers on HR outsourcing decisions, one pattern appears more consistently than any other: the employers who are overpaying for health coverage inside their PEO relationship are usually the last to know it. With employer health costs at $17,496 per employee in 2025 and projected to exceed $18,500 in 2026, the financial consequence of that blind spot is growing larger every renewal cycle.
This article explains why that gap exists, how PEO purchasing pools affect pricing, and the specific steps an independent CPA-led advisor can take to determine — with precision — whether your current arrangement is delivering fair value.
Why Most Employers Cannot Answer a Simple Question

The question is straightforward: Is your PEO charging you a fair price for health insurance?
Most employers with 25 to 500 employees genuinely cannot answer it. Not because they lack financial sophistication, but because the structure of a PEO relationship makes comparison nearly impossible from the inside.
Here is the core problem. When you signed your PEO agreement, you entered a co-employment structure in which the PEO pools your employees alongside thousands of others to negotiate group benefits at scale. That pooled purchasing power is a legitimate advantage — one of the primary reasons employers select a PEO in the first place.
The problem is that the same structure that enables pooled pricing also obscures individual pricing. Your benefits invoice reflects a bundled cost that rarely separates what you are paying for health coverage from what you are paying for administrative fees, workers’ compensation loads, and other embedded charges.
Without that separation, you cannot benchmark. Without a benchmark, you cannot negotiate. Without negotiation leverage, your renewal becomes automatic — and annual cost increases go unchallenged.
What the Data Reveals About PEO Health Costs
Healthcare cost inflation is not uniform across PEO providers. The underlying plan designs, carrier relationships, benefits load factors, and administrative fee structures vary significantly from one PEO to another — even for employers in the same industry with comparable workforce demographics. Strategic Co-Employment: Supporting Long-Term Success for Growth
The scale of the cost pressure in 2025 makes this variation increasingly consequential. According to Mercer, prescription drug spending rose 9.4 percent on average among large employers in 2025, driven in part by expanded GLP-1 medication coverage. The KFF 2025 Employer Health Benefits Survey confirms that family premiums increased 6 percent year over year — outpacing both wage growth of 4 percent and inflation of 2.7 percent. Small and mid-sized businesses with 10 to 199 employees are absorbing these increases with less negotiating leverage than larger organizations, making independent advisory support particularly valuable at this market size.
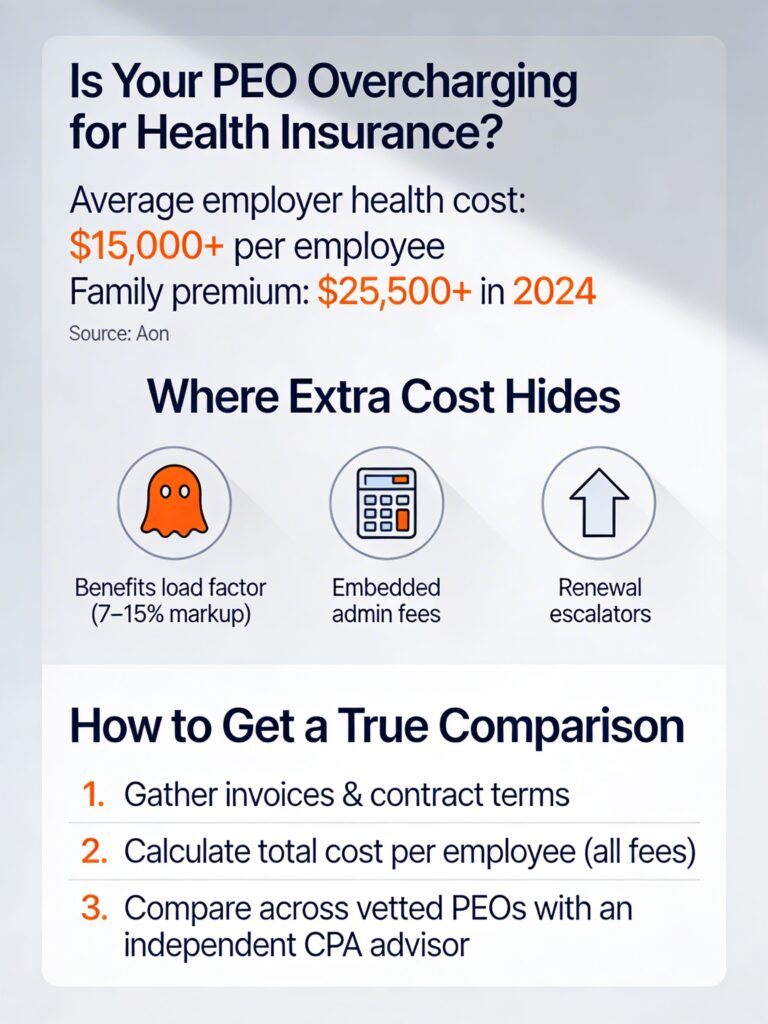
Benefits Load Factor Defined: A benefits load factor is the percentage markup that a Professional Employer Organization adds to the cost of employee benefits. This markup typically covers PEO administrative expenses, risk pooling costs, and margin. Industry contract analysis indicates this factor commonly ranges from 7 to 15 percent of total benefit costs — and most employers do not realize it exists because it is embedded in aggregate pricing rather than disclosed as a separate line item.
For a company with 100 employees spending $1.75 million annually on health benefits — consistent with 2025 average employer costs per Mercer — a 10 percent undisclosed load factor represents $175,000 in additional cost that does not appear as a named expense in any invoice. It is simply absorbed into the total.
The variation across PEO providers is where the opportunity lies. Independent advisors who work across multiple PEO relationships regularly observe cost differentials of 10 to 30 percent for comparable benefit designs — differentials that are invisible until a structured, side-by-side comparison is conducted.
How PEO Purchasing Pools Actually Work — and Where the Advantage Can Erode
The large-group purchasing pool is the mechanism by which a PEO aggregates its entire client base into a single benefits negotiation. A PEO with 50,000 co-employees has considerably more leverage with carriers than a standalone employer with 75.
In theory, this delivers meaningful cost reduction. In practice, the degree to which that savings flows through to individual client employers — rather than remaining within the PEO’s own margin structure — depends entirely on how the PEO prices its benefits model.
- IRS-certified PEOs (Certified Professional Employer Organizations, or CPEOs) are required to meet federal financial standards, but certification does not regulate how benefits costs are structured or disclosed within the client relationship.
- ESAC-accredited PEOs demonstrate financial stability and adherence to professional standards, which reduces risk — but accreditation does not guarantee competitive health plan pricing.
- The annual renewal process is where cost erosion most frequently occurs. Without independent data from competing PEO providers, an employer has no mechanism to challenge a renewal increase.
Why Going Directly to Multiple PEOs Does Not Solve the Problem
A logical response to this challenge might be: contact three or four PEO providers directly and compare their proposals.
This approach has a structural limitation that makes true comparison nearly impossible.
Each PEO presents its benefits proposal using its own pricing terminology, bundling logic, and fee disclosure conventions. One provider shows an administrative fee as a percentage of payroll. Another embeds it within a per-employee-per-month charge. A third includes it within the benefits load factor. Without a standardized framework for translating those structures into comparable numbers, the proposals do not produce a meaningful comparison — they produce confusion.
Additionally, when an employer contacts PEO providers directly, each provider controls the information presented. Fees that are negotiable are quoted at list price. Plan designs that could be customized are presented as standard. The negotiation leverage that exists for an independent advisor who works across dozens of client relationships does not exist for an employer conducting a single evaluation.

Key Insight: A true apples-to-apples cost comparison across multiple PEO providers — one that accounts for bundled fees, plan design equivalency, benefits load factors, and total employer cost — is only achievable through an independent advisor who operates outside the sales process of any individual PEO.
What an Independent CPA-Led Benefits Cost Review Examines
A structured, independent review of your current PEO health plan costs goes well beyond comparing premium rates. The analysis examines the full cost architecture of your benefits arrangement, including elements that rarely appear on a standard invoice.
- Benefits Load Factor Disclosure: Does your current PEO agreement explicitly state the benefits load factor as a named percentage? If not, a contract review can identify where it is embedded and what it represents in dollar terms.
- Plan Design Equivalency: Comparing premium costs without controlling for plan design produces meaningless data. The review establishes a standardized benefits profile — deductibles, copays, out-of-pocket maximums, network type — and then prices that profile across competing PEO providers on identical terms.
- Total Employer Cost per Employee: The benchmark that matters is not the quoted premium. It is the total employer cost per employee per year, inclusive of all administrative fees, load factors, and any embedded charges that affect the actual cost of coverage.
- Renewal Escalation Structure: Does your agreement include provisions that automatically increase benefits costs at renewal without requiring renegotiation? These clauses are common and consequential. Identifying them before renewal season provides the opportunity to negotiate or replace the arrangement on your timeline rather than the PEO’s.
- Market Comparison Across Vetted PEO Providers: Once the current cost structure is fully documented, a side-by-side comparison against competing PEO providers — using the same plan design equivalency framework — reveals whether meaningful savings are achievable through negotiation or transition.
What the Numbers Typically Show
Independent advisors conducting structured benefits cost comparisons for mid-market employers consistently observe a pattern. Employers who have never conducted an independent review of their PEO health costs are frequently paying 10 to 30 percent more than the available market rate for comparable coverage.
The source of that differential is rarely misconduct on the part of the PEO. It is more commonly a combination of three factors: an undisclosed benefits load factor, a plan design that has not been renegotiated since the original contract, and annual renewal increases that have compounded without challenge.
For a 75-employee company, a 15 percent overpayment on a 2025 average benefits cost of approximately $1.3 million represents nearly $200,000 per year in recoverable savings. That figure is not theoretical. It is the outcome that structured, independent advisory work is designed to surface and capture.
How to Conduct a No-Cost Benefits Cost Comparison
PEOAdvisor.com offers a free, independent assessment that provides a side-by-side benefits cost comparison across vetted PEO providers. The assessment is conducted without vendor bias, with full fee disclosure, and without requiring you to engage in a sales process with any individual PEO.
The process begins with a structured intake that captures your current benefits costs, plan design, workforce demographics, and contract terms. That profile is then used to produce a standardized comparison across PEO providers whose capabilities, certification status, and service models align with your specific business requirements.

- The comparison reflects total employer cost — not quoted premiums.
- Every fee category is named and disclosed, including benefits load factors where applicable.
- The analysis covers IRS-certified and ESAC-accredited providers, with service quality and responsiveness criteria applied alongside cost data.
- The outcome is a clear, actionable report — not a sales pitch from a provider competing for your account.
Before your next PEO renewal, you should know whether your current arrangement reflects the market. The assessment provides that answer at no cost.
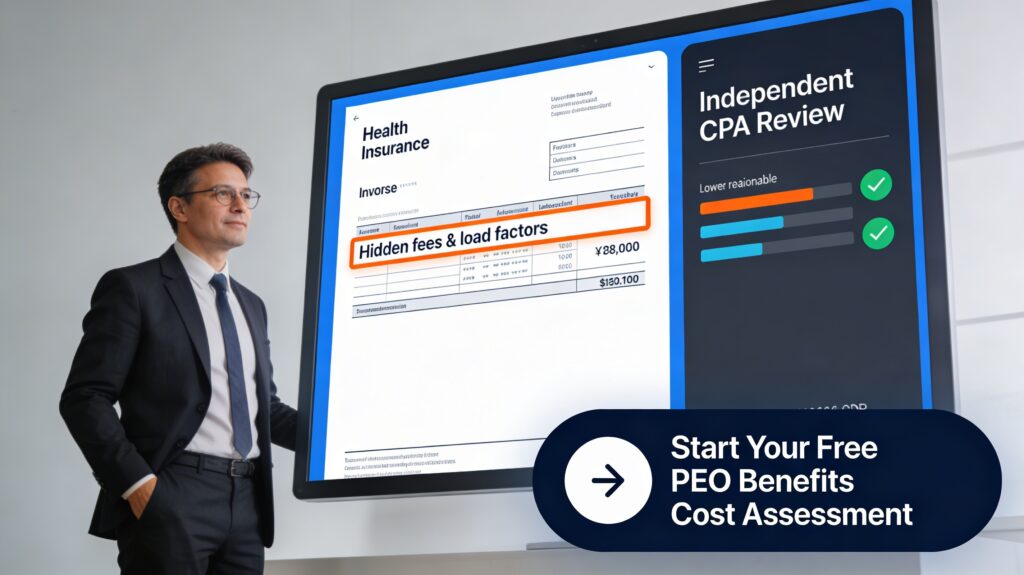
Start Your Free PEO Benefits Cost Assessment: PEOAdvisor.com provides an independent, no-cost benefits cost comparison across vetted PEO providers. Full fee disclosure. No vendor relationships. Employer-focused guidance from a CPA advisor with 37 years of experience.
Request Your Free Assessment: PEOAdvisor.com

- How can I quickly tell if my current PEO’s health plan costs are higher than what similar-sized businesses are paying? A small or mid-sized business can get an initial read on whether its PEO health plan is overpriced by comparing total employer health cost per employee (not just premiums) to widely cited benchmarks such as Aon’s figure of more than 15,000 dollars per employee per year and average family premiums above 25,500 dollars in 2024. If your all in cost per employee is materially higher than those levels for comparable plan richness, or you have not renegotiated in several years despite steady increases, that is a strong signal to perform a more formal benchmark against other vetted PEOs
- If I’m overpaying, is it realistic to renegotiate with my current PEO instead of going through the pain of switching providers? If you discover you are overpaying, it is often realistic to use an independent comparison as leverage to renegotiate with your current PEO rather than immediately switching. When a structured, apples to apples analysis shows your total costs are 10 to 30 percent above what similar employers are paying for comparable designs, many PEOs will adjust benefits load factors, administrative fees, or plan structures to retain your business, especially if you can demonstrate you have credible alternatives.
- What specific documents or numbers do I need to gather so an advisor can calculate my true total cost per employee, including any hidden fees or load factors? To enable an advisor to calculate your true total cost per employee, you typically need to gather your PEO invoices (showing health premiums, fees, and any per employee or percentage of payroll charges), your current PEO contract or service agreement (including any renewal escalation language), and basic workforce and plan data. At minimum, that means providing headcount, current annual benefits spend, plan summaries with deductibles and out of pocket maximums, and any documentation that outlines how administrative fees and benefits load factors are applied so hidden markups can be translated into clear, per employee cost.


