As of August 2026.
Executive Summary
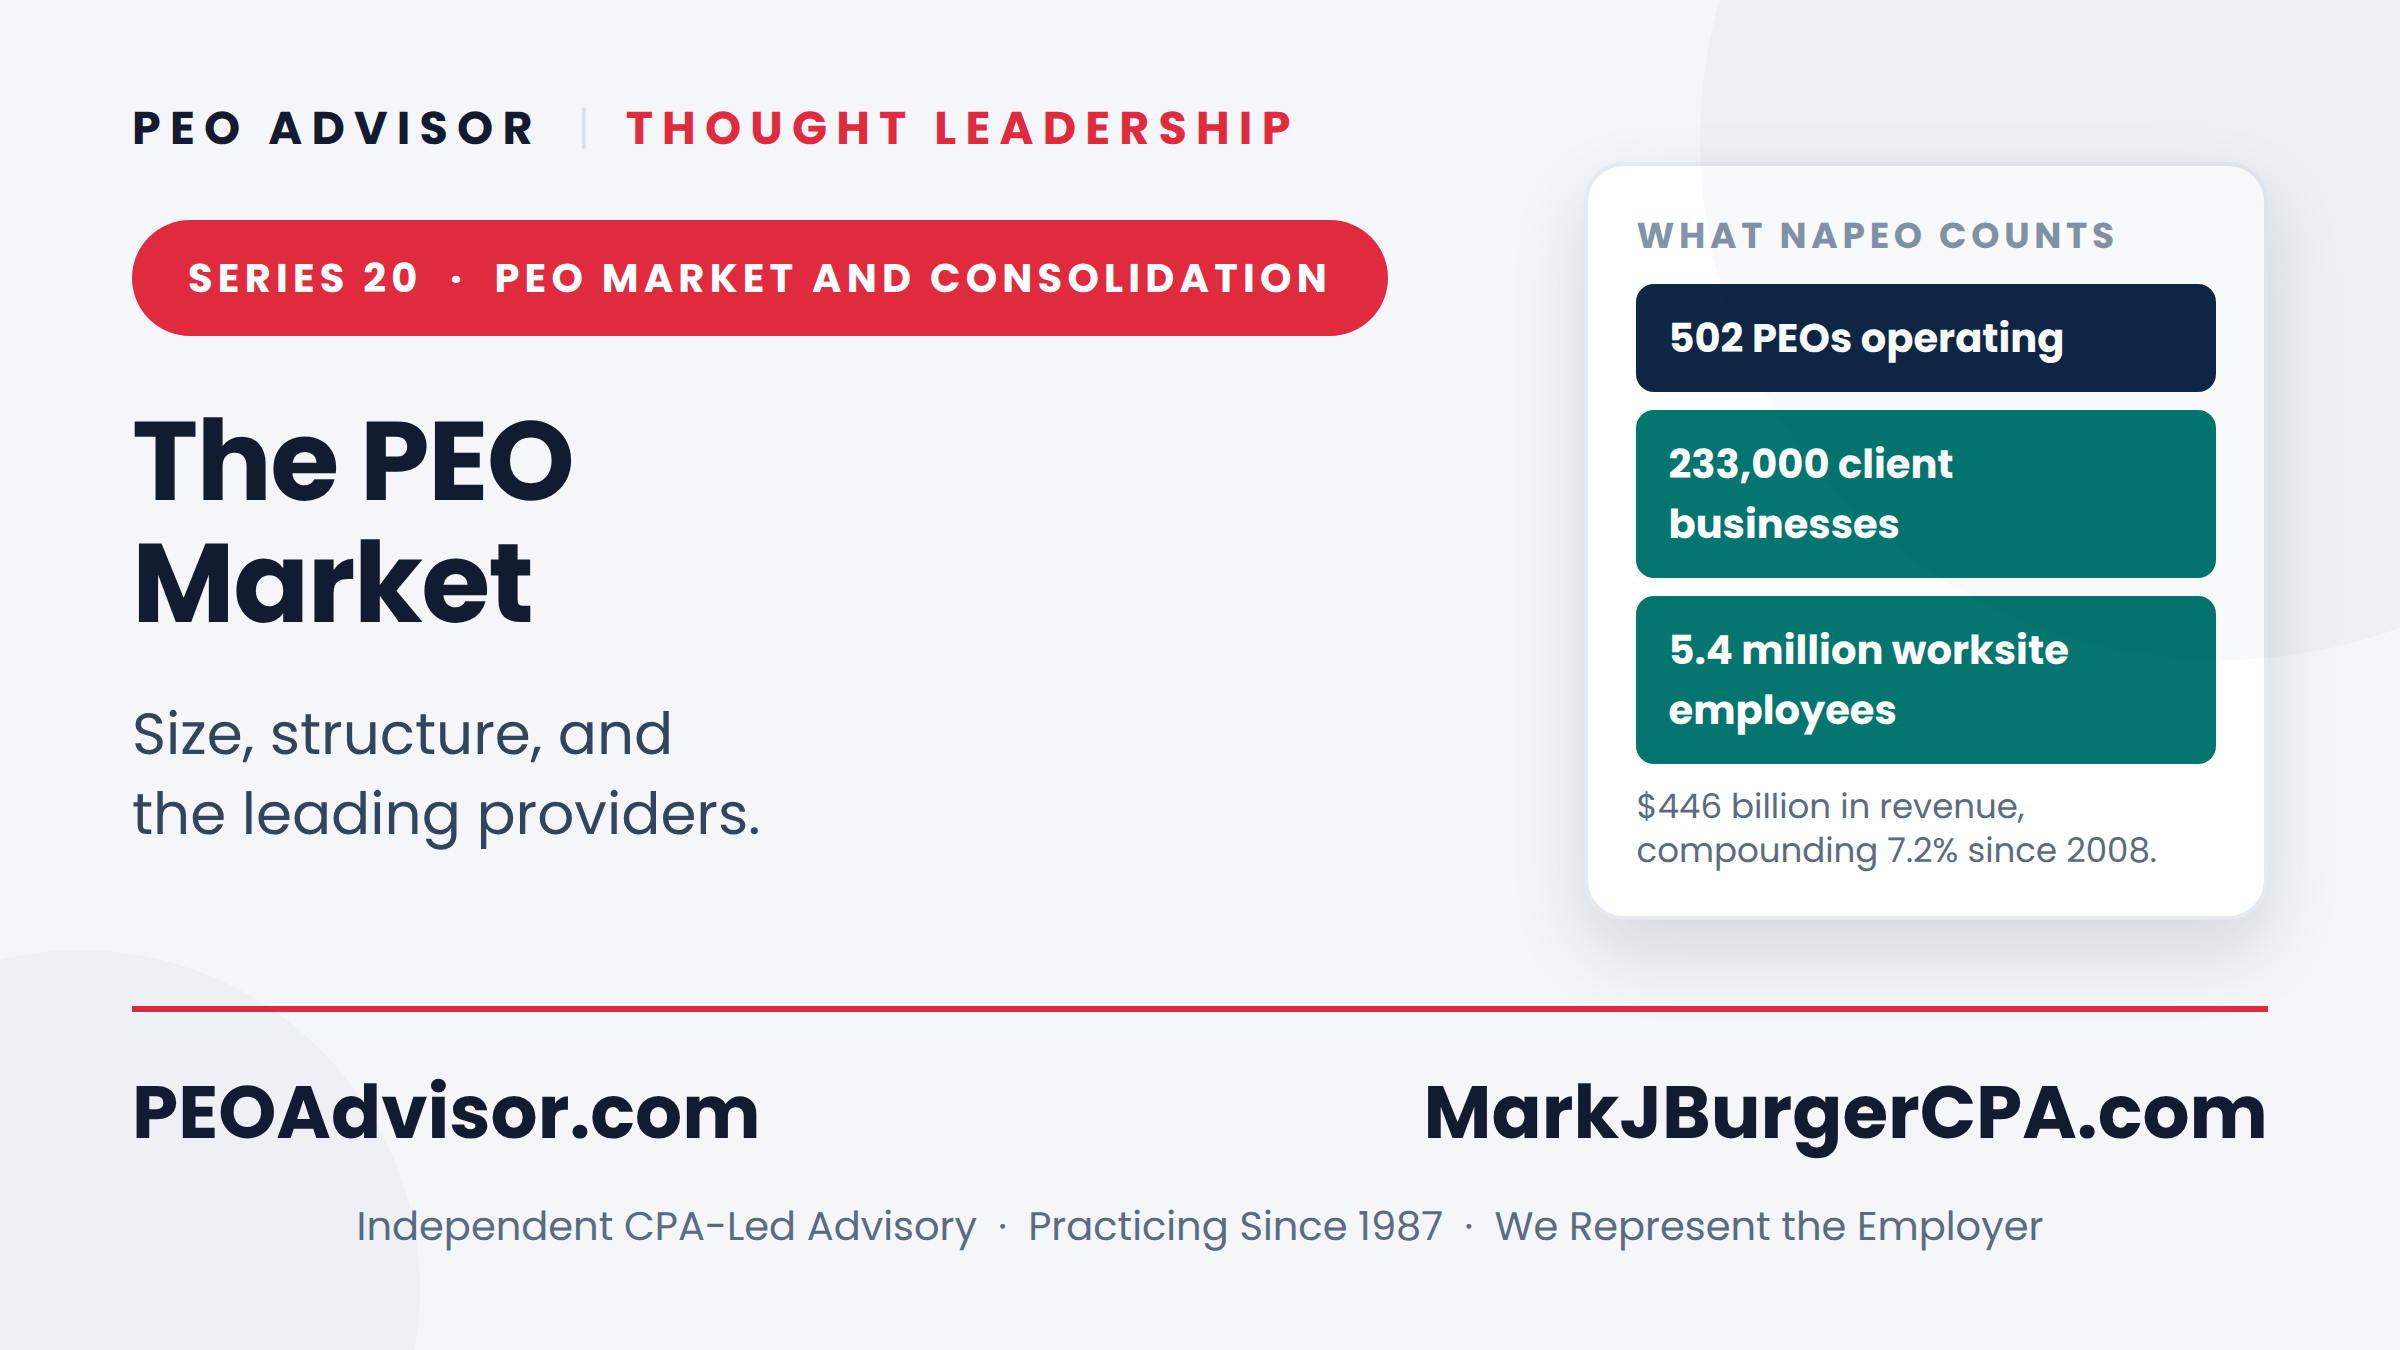
PEO market size is substantial and still growing, yet the industry is unevenly concentrated. NAPEO counts 502 PEOs serving roughly 233,000 client businesses and 5.4 million worksite employees. Industry revenue is an estimated $446 billion, compounding at 7.2 percent a year since 2008. Concentration sits at the top. On the last breakdown NAPEO published, the five largest providers held about 39 percent of worksite employees, and the next 25 firms roughly 19 percent. This analysis sizes the market, profiles its tiers and leaders, and explains what the structure means for buyers.
What Is the PEO Market Size?
The industry is mainstream, not niche. NAPEO counts 502 PEOs serving roughly 233,000 client businesses and 5.4 million worksite employees, in an industry generating an estimated $446 billion in revenue and compounding at 7.2 percent a year since 2008. About 14 percent of employers with 20 to 499 employees now use one. That scale matters for buyers: this is an established, competitive market, and the pooled purchasing power behind it is substantial. Understanding the size frames the leverage a well-run evaluation can capture.
| Tier | Share of worksite employees (2022 data) | What it offers buyers |
|---|---|---|
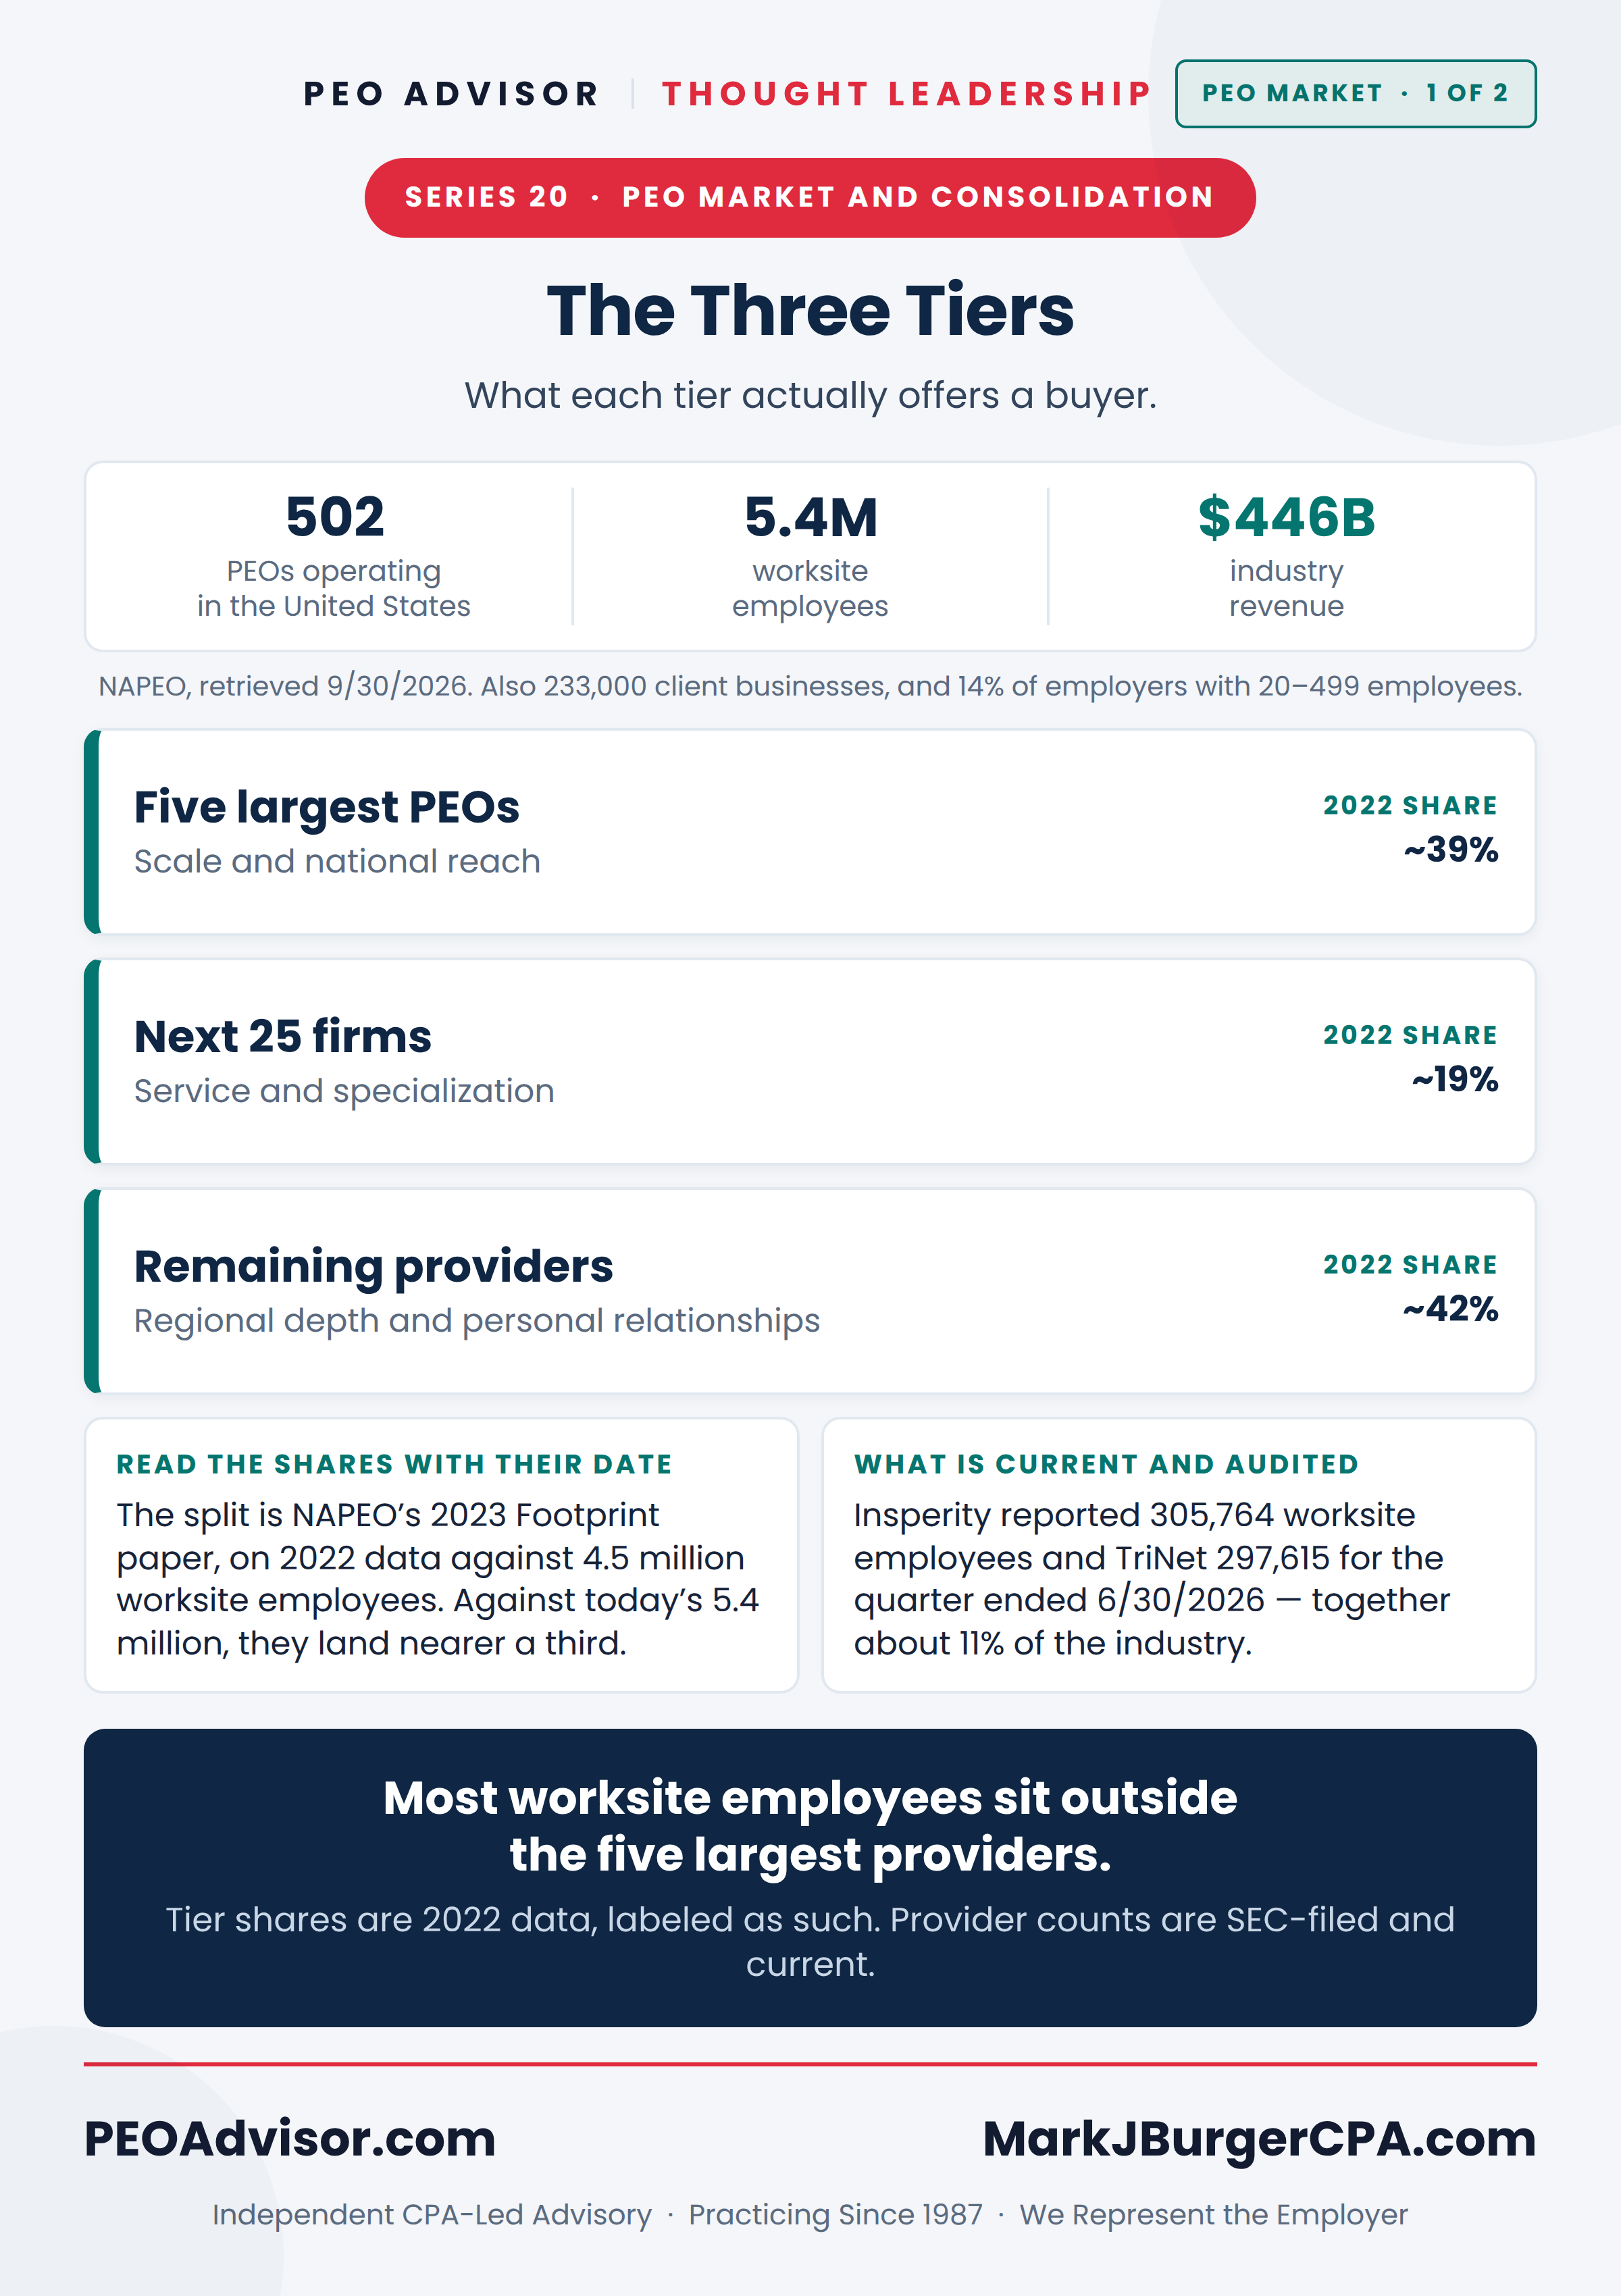
| Five largest PEOs | ~39% | Scale and national reach |
| Next 25 firms | ~19% | Service and specialization |
| Remaining providers (long tail) | ~42% | Regional depth and personal relationships |
What Are the Three Tiers of the PEO Market?
The market divides into a few giants, a competitive middle, and a long tail. On NAPEO’s last published breakdown, the five largest PEOs accounted for about 39 percent of worksite employees, the next 25 firms roughly 19 percent, and the remaining providers approximately 42 percent. Read that split with its date attached. It comes from NAPEO’s 2023 Footprint paper and rests on 2022 data, when the industry counted 4.5 million worksite employees rather than today’s 5.4 million.
The denominator matters. Hold the top five’s absolute count constant and those firms land nearer one-third of the current total. The industry grew faster than the reported share implies. Either way the structural point holds: most worksite employees sit outside the five largest providers. Each tier serves buyers differently. The giants offer scale and national reach. The middle competes on service and specialization. The long tail delivers regional depth. Knowing a provider’s tier sets expectations for price, service, and flexibility; a CPA-led framework for choosing the right PEO partner applies that lens to the selection itself.
| Not sure which tier fits your business? Get a no-cost, cross-tier read on how PEO options compare for your company before you shop the market, through the PEO Advisor assessment. Start the PEO assessment |
Who Are the Leading PEO Providers?
A recognizable set of names anchors the top tier. ADP TotalSource, a division of ADP, Inc., ranks among the largest by revenue, alongside Insperity, TriNet, and Paychex, which absorbed Oasis and later Paycor. Vensure Employer Solutions has grown into a major force through acquisition. Five of the largest are publicly traded and therefore file quarterly: ADP, Paychex, Insperity, TriNet, and Barrett Business Services. Others are private or private-equity-backed.
Public filings are the only audited provider counts available. For the quarter ended June 30, 2026, Insperity reported 305,764 average paid worksite employees and TriNet 297,615. Together that is roughly 11 percent of the 5.4 million NAPEO counts. ADP does not break TotalSource out separately, so its share cannot be verified at all. Treat any single market-share percentage with care, including one quoted in a proposal. The roster shifts as deals close, a pattern set out in our analysis of the PEO M&A landscape and what it means for clients. For an earlier market-share snapshot, see the top 10 PEOs by market share for 2022 and 2023.
What Is a Cross-Tier Comparison Worth? A Worked Example
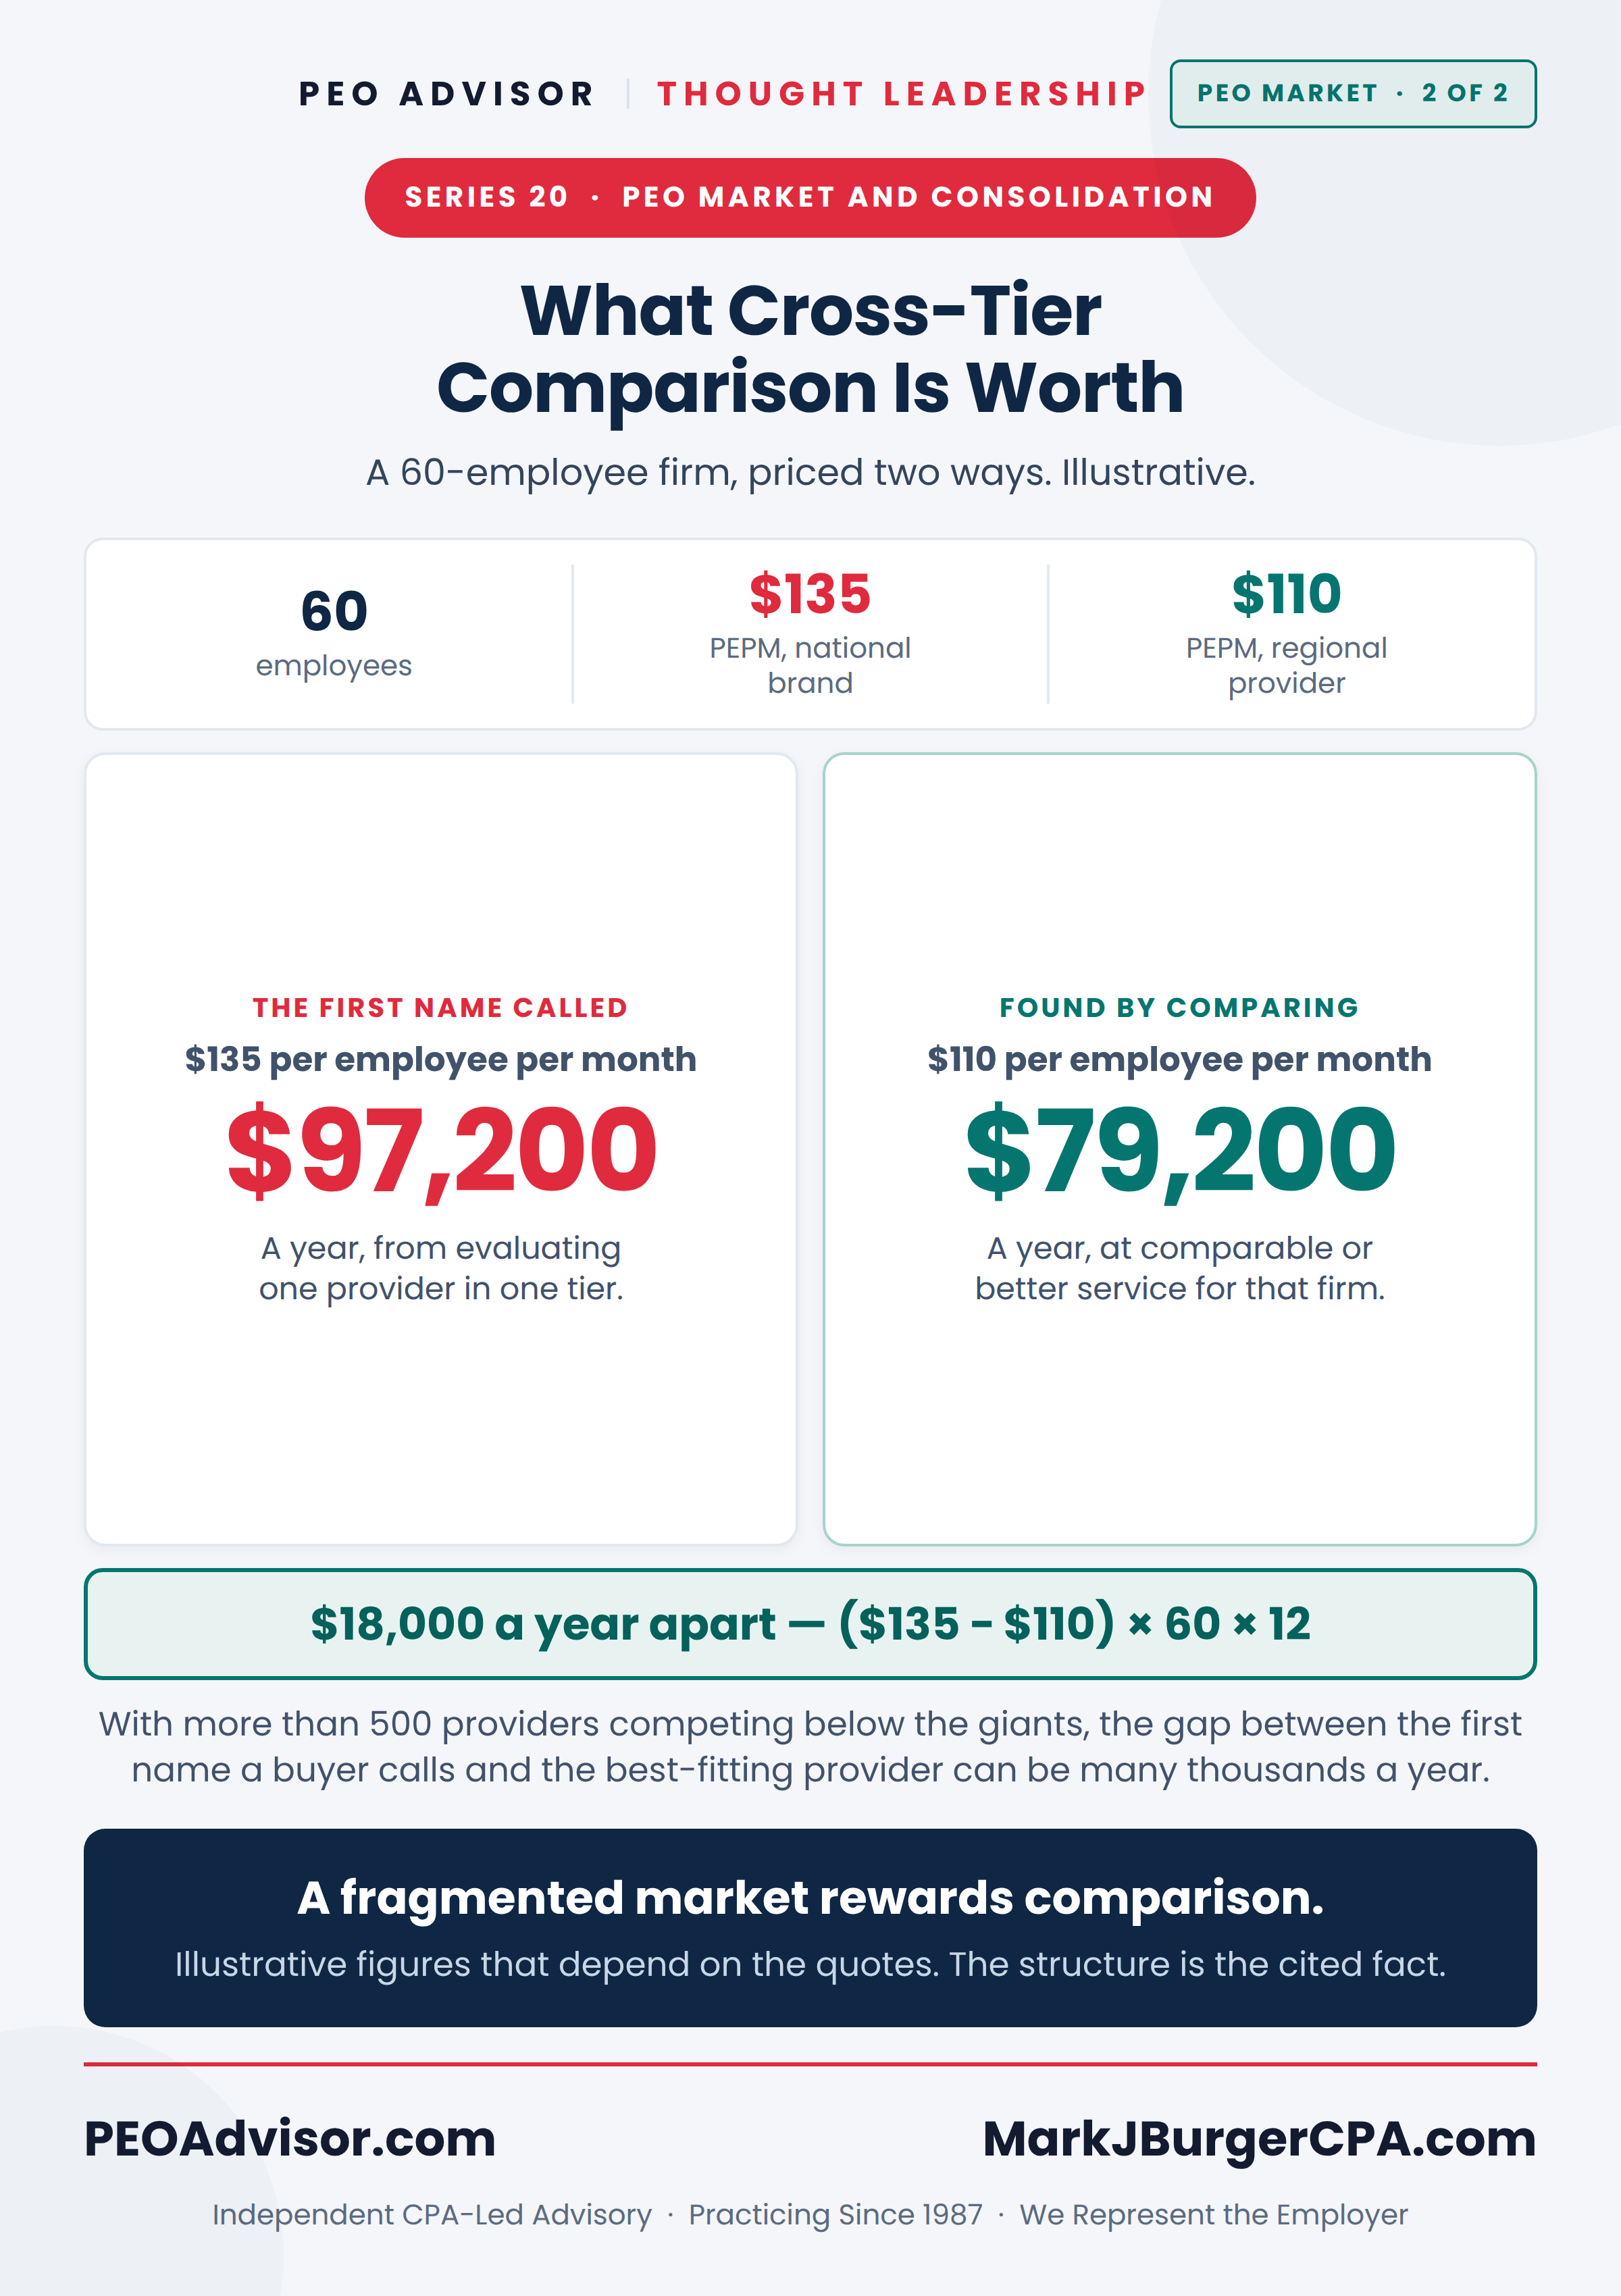
Worked example (illustrative). Consider a 60-employee firm choosing a PEO. If it goes straight to a single household name, it effectively evaluates one provider in the top tier. But NAPEO counts 502 providers across three tiers. Suppose a cross-tier comparison surfaces a regional PEO whose administrative fee is $110 per employee per month against a national brand’s $135 (see how per-employee-per-month pricing compares with percentage of payroll) — a difference of (135 − 110) × 60 × 12 = $18,000 a year, at comparable or better service for that firm’s industry. The point of the market’s fragmentation is precisely this: with hundreds of providers competing below the giants, the gap between the first name a buyer calls and the best-fitting provider can be many thousands of dollars a year. The figures are illustrative and depend on the quotes; the structural fact — more than 500 providers, with most worksite employees outside the five largest — is what makes comparison pay.
Does It Matter Whether a PEO Is Publicly Traded or Private?
Ownership type shapes how a PEO behaves. Publicly traded PEOs manage to quarterly financial targets, which can influence pricing cycles, while private and private-equity-backed platforms often pursue aggressive acquisition strategies. Neither is inherently better for a buyer, but the ownership model affects pricing behavior, service consistency, and the likelihood of a future transaction. Factoring ownership into an evaluation helps a buyer anticipate how a provider will act over the life of the relationship.
How Many PEOs Are IRS-Certified?
Certification is rarer than the marketing suggests. The IRS publishes its list of Certified PEOs each quarter. The list report-dated August 7, 2026 carries 124 certified legal entities, which resolve to roughly 60 distinct PEO organizations once multiple registrations under one parent are collapsed; ADP TotalSource alone accounts for 18 of the entities. Against NAPEO’s 502 PEOs, that is about one provider in eight.
The distinction carries real money. Under Internal Revenue Code section 3511, a Certified PEO is treated as the employer for federal employment-tax purposes on wages it pays, so a client is generally not left liable if that PEO fails to remit. A non-certified PEO offers no such protection, and the client remains exposed. Ask whether a provider is certified, then verify the answer against the IRS list rather than the brochure. Certification status is a fact a buyer can look up; fit is not.
Case in Point
Case in point (illustrative). Two similar firms shopped for a PEO. The first called the most-marketed national name, took its quote, and signed — a reasonable provider, but chosen without comparison. The second ran a cross-tier evaluation: it weighed a top-five strategic, a mid-tier specialist in its industry, and two regional providers, and found that the mid-tier specialist offered stronger industry expertise and service at a competitive fee. Same market, different outcome — separated by whether the buyer treated a fragmented market as an invitation to compare or defaulted to the biggest name. This scenario is illustrative and does not describe an identifiable company.
What Does Fragmentation Mean for Buyers?
A fragmented market rewards comparison. Because hundreds of providers compete below the giants, buyers have real choice — and the biggest, most-marketed name is rarely the only good fit. Regional and specialty PEOs frequently offer stronger service or industry expertise than a national brand for a given business. The practical implication is that an independent, cross-tier evaluation almost always surfaces better-fitting options than going straight to a household name, which is the core of PEOAdvisor.com’s approach.

How Do You Read the Market as a Buyer? A Step-by-Step
- Do not default to a household name — more than 500 providers compete, and most worksite employees sit outside the five largest; the fit may sit elsewhere.
- Match the tier to your needs — scale from the giants, specialization from the middle, regional depth from the long tail.
- Factor in ownership — publicly traded versus private-equity-backed affects pricing behavior and deal likelihood.
- Compare across tiers — put a strategic, a specialist, and a regional provider side by side on a true all-in cost.
- Check certification — confirm whether the provider appears on the IRS active CPEO list, because only about one PEO in eight does.
- Use an independent evaluation — a cross-tier read surfaces better-fitting options than a single vendor’s pitch.
Want to see the whole market, not just the big names? Contact Mark J. Burger, CPA for an independent, cross-tier PEO comparison.
Sources and basis. Industry totals are NAPEO figures retrieved September 30, 2026: 502 PEOs, roughly 233,000 client businesses, 5.4 million worksite employees, an estimated $446 billion in revenue, and compound annual growth of 7.2 percent since 2008. The tier shares (the five largest about 39 percent, the next 25 about 19 percent, the remainder about 42 percent) are from NAPEO, The PEO Industry Footprint 2023, Figure 2, and rest on 2022 data measured against 4.5 million worksite employees; NAPEO has not republished that split against its current total. Worksite-employee counts for Insperity (305,764) and TriNet (297,615) are from each company’s SEC-filed results for the quarter ended June 30, 2026. The certification count is the IRS active CPEO list report-dated August 7, 2026. The named leaders and their ownership are as publicly reported. The $135 and $110 per-employee-per-month fees, the 60-employee firm, and the two-firm case are illustrative and do not describe an identifiable company. This content is educational, not legal or tax advice.
Frequently Asked Questions
How big is the PEO industry?
NAPEO counts 502 PEOs serving roughly 233,000 client businesses and 5.4 million worksite employees. Industry revenue is an estimated $446 billion, compounding at 7.2 percent a year since 2008. About 14 percent of employers with 20 to 499 employees use one. The market is mainstream and competitive, with substantial pooled purchasing power behind it – scale a disciplined evaluation can turn into leverage.
Who are the largest PEO companies?
ADP TotalSource is a division of ADP, Inc. It ranks among the largest by revenue, alongside Insperity, TriNet, Paychex, and Vensure Employer Solutions. Five of the largest are publicly traded: ADP, Paychex, Insperity, TriNet, and Barrett Business Services. For the quarter ended June 30, 2026, Insperity reported 305,764 average worksite employees and TriNet 297,615. Together that is roughly 11 percent of the industry.
How is the PEO market structured?
In three tiers. NAPEO last published the split in its 2023 Footprint paper, on 2022 data. The five largest PEOs held about 39 percent of worksite employees, the next 25 firms roughly 19 percent, and the remainder about 42 percent. The giants offer scale and reach. The middle competes on service and specialization. The long tail offers regional depth.
Does it matter if a PEO is publicly traded?
It can. Publicly traded PEOs manage to quarterly financial targets, which can influence pricing cycles, while private and private-equity-backed platforms often pursue aggressive acquisition strategies. Ownership affects pricing behavior, service consistency, and the likelihood of a future transaction, so factoring it into an evaluation helps anticipate how a provider will act over time.
Is a bigger PEO better?
Not necessarily. Because the market is fragmented below the giants, buyers have real choice, and regional or specialty PEOs frequently offer stronger service or industry expertise than a national brand for a given business. The biggest, most-marketed name is rarely the only good fit, which is why an independent, cross-tier evaluation is valuable.
How fast is the PEO industry growing?
NAPEO reports compound annual growth of 7.2 percent since 2008. The industry now counts 502 PEOs, roughly 233,000 client businesses, and 5.4 million worksite employees. Growth reflects rising adoption among small and mid-sized businesses seeking benefits access, compliance support, and administrative relief. It is occurring alongside significant consolidation among providers.
How many PEOs are IRS-certified?
The IRS active CPEO list report-dated August 7, 2026 carries 124 certified legal entities. Those resolve to roughly 60 distinct PEO organizations once multiple registrations under one parent are collapsed. Against the 502 PEOs NAPEO counts, that is about one provider in eight. Certification matters: a Certified PEO assumes federal employment-tax liability for wages it pays, and a non-certified PEO does not.
About the author. Mark J. Burger, CPA, advises small and mid-sized businesses on strategic workforce and co-employment decisions through GuidePoint PEO LLC. His analysis draws on a CPA practice dating to 1987 and hundreds of PEO cost assessments.
Independent CPA-Led Advisory · Practicing Since 1987 · We Represent the Employer